
Thorner
-
Posts
37,639 -
Joined
Content Type
Profiles
Forums
Events
Everything posted by Thorner
-
 Another awful pass from Tuch
 -
Pretty good front of net D work from DC. This is why he’s best at C
-
Botterill dealt him to the Habs for Redmond, no?
-
Put together a package for a checking 3C. We have the assets My entire point was to NOT just...wait around, but. Ya
-
Best part of that Quinn goal might have actually been the pass he makes to JJ before JJ is even looking. It was like a QB that throws before the receiver has even exited out of their break. It got JJ the puck in space with speed and Quinn was easily able to get open after that
-
Sweet. I am. Advanced metrics say L2 is more dominant
-
It’s our best line, full stop. Tage is just an animal all on his own
-
Just a truly awful pass from Tuch into a wide open Dahlin’s skates Great finish to frame nonetheless
-
Can see why KA has apparently decided it’s time to push forward a bit. Our top 2 lines are ready to win now. Would be an objective mistake to not attempt to harvest that now with adequate supplementation
-
Mittelstink line on
-
All the data
-
If I was Kevyn Adams I would simply fill out the other three lines with exact replicas of Cozens Quinn and JJ
-
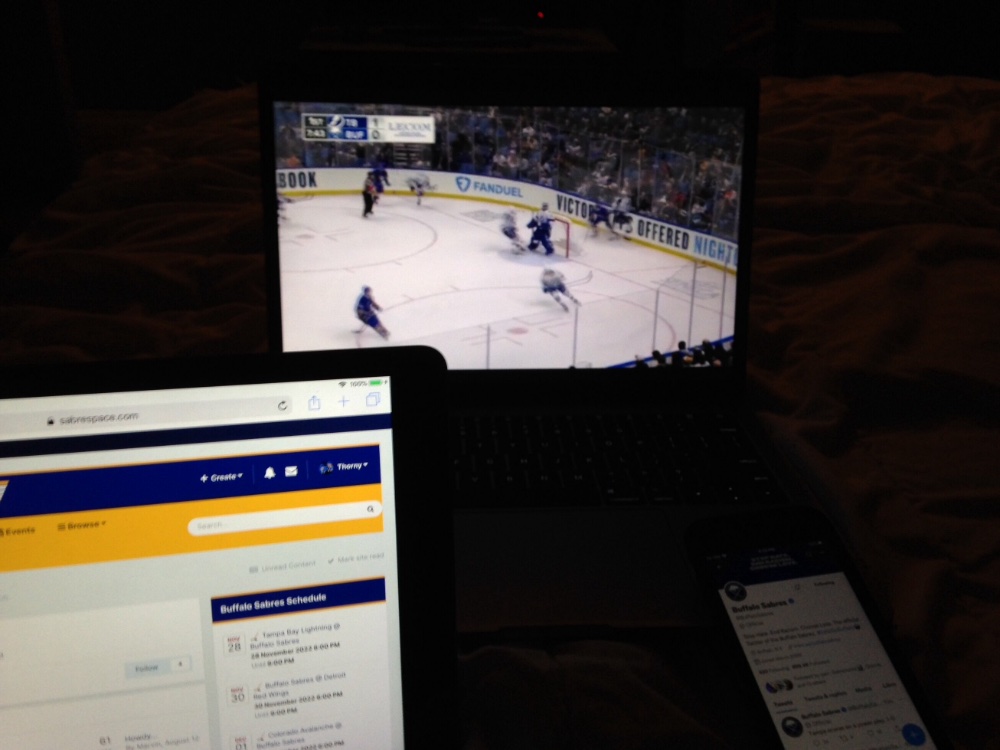
Game time baby
-
Me neither, that’s why i was hesitant to post it, fearing potential reaction. But it’s already up.
-
Imo anyone below 30 is a rook thats the definition I use anyways - - - I also refer to these players as “castles”
-
I mean, no, I didn’t, that’s kinda why I was asking for info.
-
Re: accounting for assists, too: I *believe* liger’s chart, due to the “impact on” verbiage does include/allow for assist creation for expected impacts, but waiting on confirmation. The biggest difference re: looking at the chart or just pulling raw stats off the scoring leaders chart is the “expected” and “per 60” designations. Ie it’s attempting the usual “advanced” component of advanced stats with the “expected” component ie levelling the playing field by accounting for things like randomness/luck where the shots are being taken from/ teammate/opponent etc etc. Then it adds the further component of the per 60 designation, supposing to again balance for production differences due merely to ice time. Even a cursory analysis of why per 60 might represent a meaningful distinction yields a readily apparent justification: it stands to follow that the players being paid the most will get the most ice time and the opportunity to produce that comes with it, logically stands to follow that breaking production down to a per-minute basis lends a more level playing field for analysis. Its another valuable way of looking at the numbers, raw totals will also always provide value
-
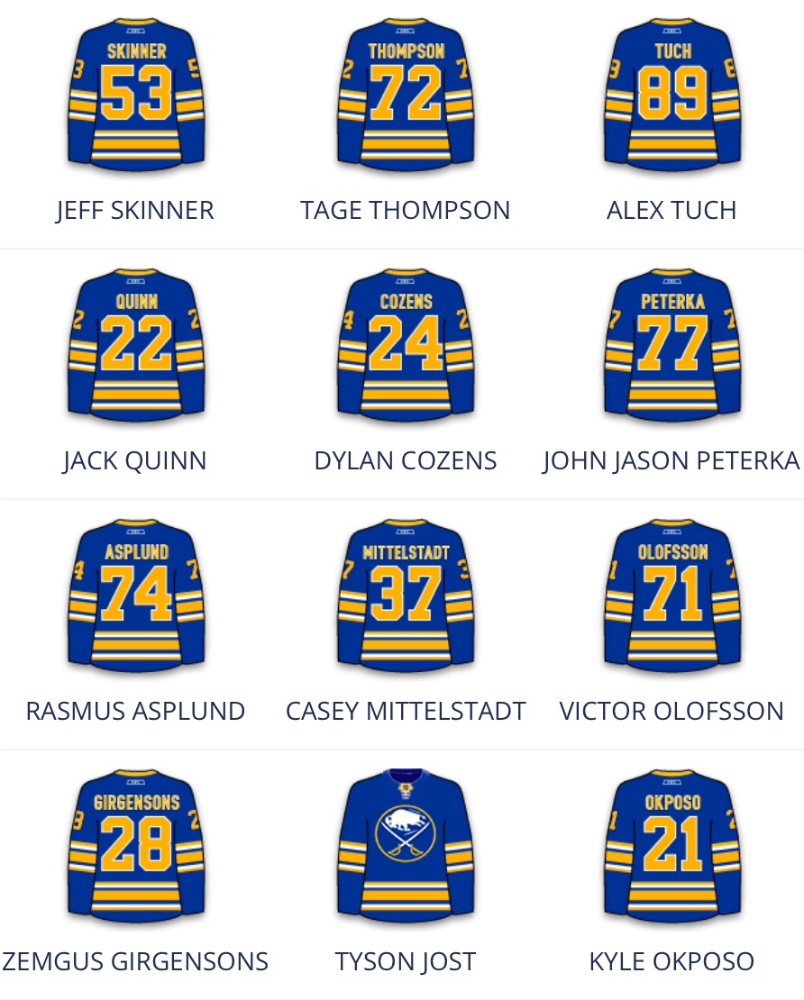
I believe Quinn has actually been lining up on the right and JJ on the left of late, but otherwise, this is accurate I think
-
I don’t want to post the video cause it just feels wrong to do so but, there is documented social media video of his significant other talking about how much disappointment there was in going to Rochester. He definitely asked out. It’s not a big deal. He’s an older dog. Edit nm the video was already posted lol
-
Wayne did?
-
Any idea if the curves change when looking at expected goals FOR and not just expected goals? The current chart is using just individual expected, correct? And it also includes PP mins in the per 60, correct? Edit: actually, it says “impact on” so perhaps this is representative of expected goals for and not just individual expected goals. I feel like sometimes people are a bit loosey goosey with the terminology which leads to confusion
-
The chart is saying that prime offensive output is 23 By expected goals for It’s not that confusing of a chart
-
Are The Sabres A Dark Horse Contender for Jakob Chychrun?
Thorner replied to Brawndo's topic in The Aud Club
Wait , we’re still counting Mitts as a “1st equivalent”? -
The game is obviously leaning younger over time so it’s important to remember things like, just because Tage is putting up a 40 goal pace now at 25 doesn’t necessarily mean he’ll be putting it up in 3 years once Levi is finally ready. Also fits the idea it’s better to pay early rather than for past performance. Of course plenty round out their full games to a greater degree at a later age, hopefully those are the guys who could be available at a slight shave of cost do to declining raw production The very best of the best I think are in their primes a bit later. Crosby became a truly elite, top 10 worthy all time player later in his career when the production technically wasn’t as high. But your average guy peaks a bit earlier.