rakish
-
Posts
1,470 -
Joined
-
Last visited
Content Type
Profiles
Forums
Events
Everything posted by rakish
-
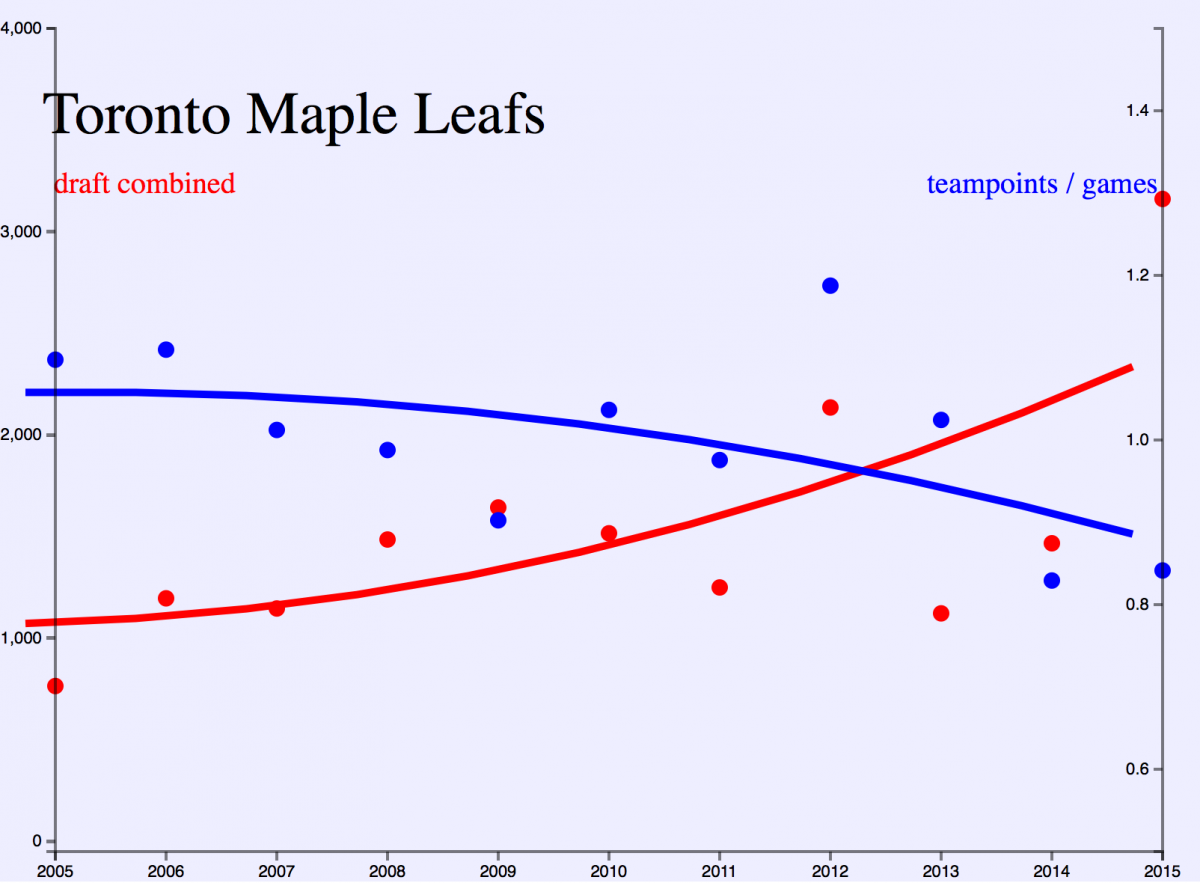
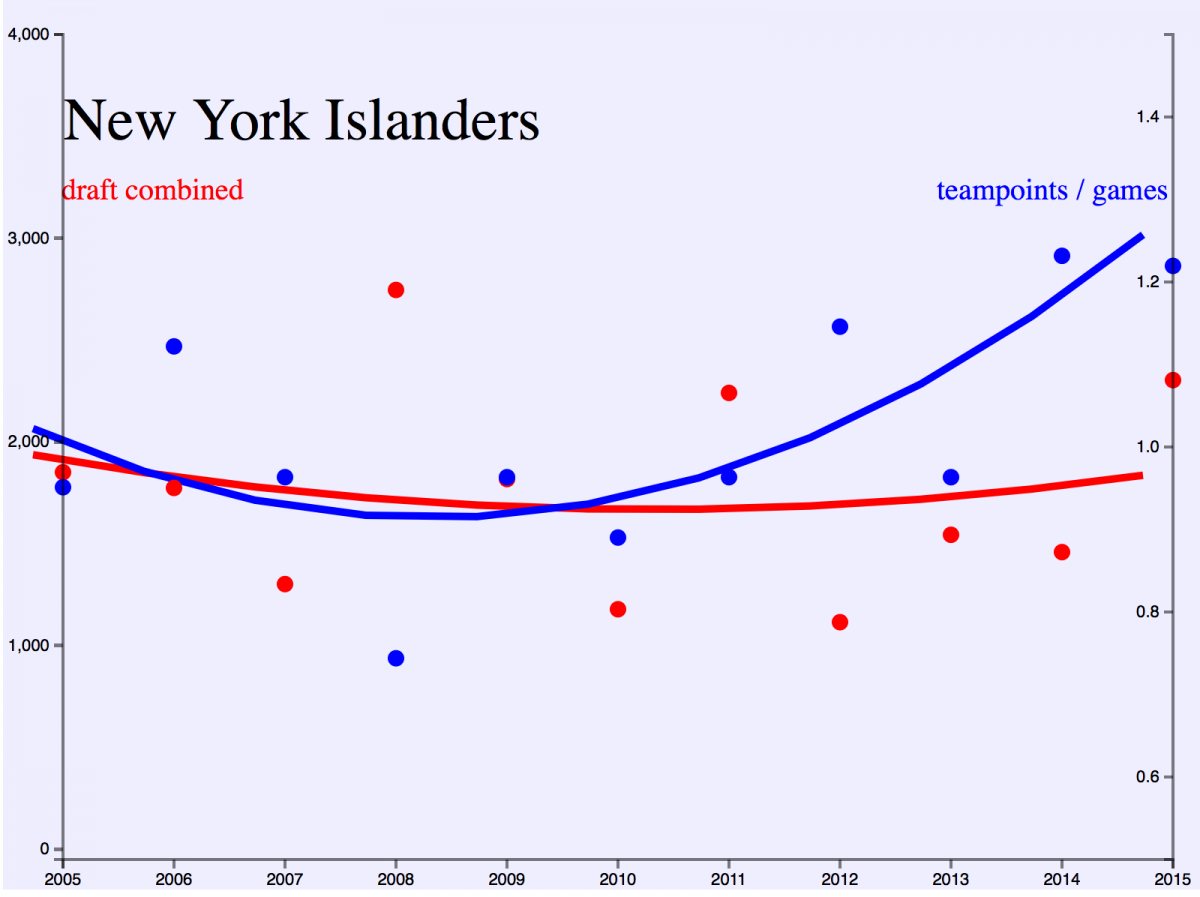
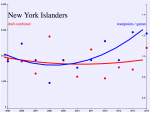
So finishing up this section, I will talk about the 3 teams I think are using analytics to draft. Now some may be a false positive, after 2014 I thought St. Louis, Nashville, Detroit, and Tampa were using analytics, but all 4 had terrible 2015 drafts. And there will be more teams drafting this way in the future, as the 2 kids from nhl numbers, who have a tool similar to mine, have disappeared. The Toronto Maple Leafs might have drafted 5 NHL players out the 2015 draft. A couple were on my draft list from last year, Marner, of course, and Timashov. But if you look at the Toronto Chart below, they got 2000 rating points outside of Marner. How did they each play in 2015? 9(th best 2015 season for forwards) MITCHELL MARNER OHL 1091(raw rating) 17 DMYTRO TIMASHOV QMJHL 764 Defensemen 3 ANDREW NIELSEN WHL 842 7 TRAVIS DERMOTT OHL 518 9 in 2014 STEPHEN DESROCHER OHL 440 - Overager 15 in 2014 STEPHEN DESROCHER OHL 381 This is a new skill that Toronto has developed, as the chart indicates there was nothing like this before. The Islanders use a tool similar to mine. And like Toronto, this is a new skill, as their 2014 combined rating shows no indication of drafting ability. The Jets also drafted 3000 rating points last season. They are coming off two solid drafts, then a great one.

-
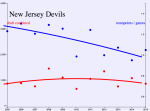
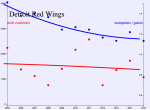
The slope isn't the key item, it's the height of the bar. The Red Wings are on a downslope, but they are still averaging 1400 or 1500 out of each draft. The Devils average only 1000 or 1100 each draft
-
Konecny spent half the year in Sarnia, half the year in Ottawa. In Sarnia, he outscored the second best scorer, Zacha, by about a half point per game, on a very good team. I generally average the two, unless they are in different leagues. Averaging Konecny's raw scores, he ends up about 12th
-
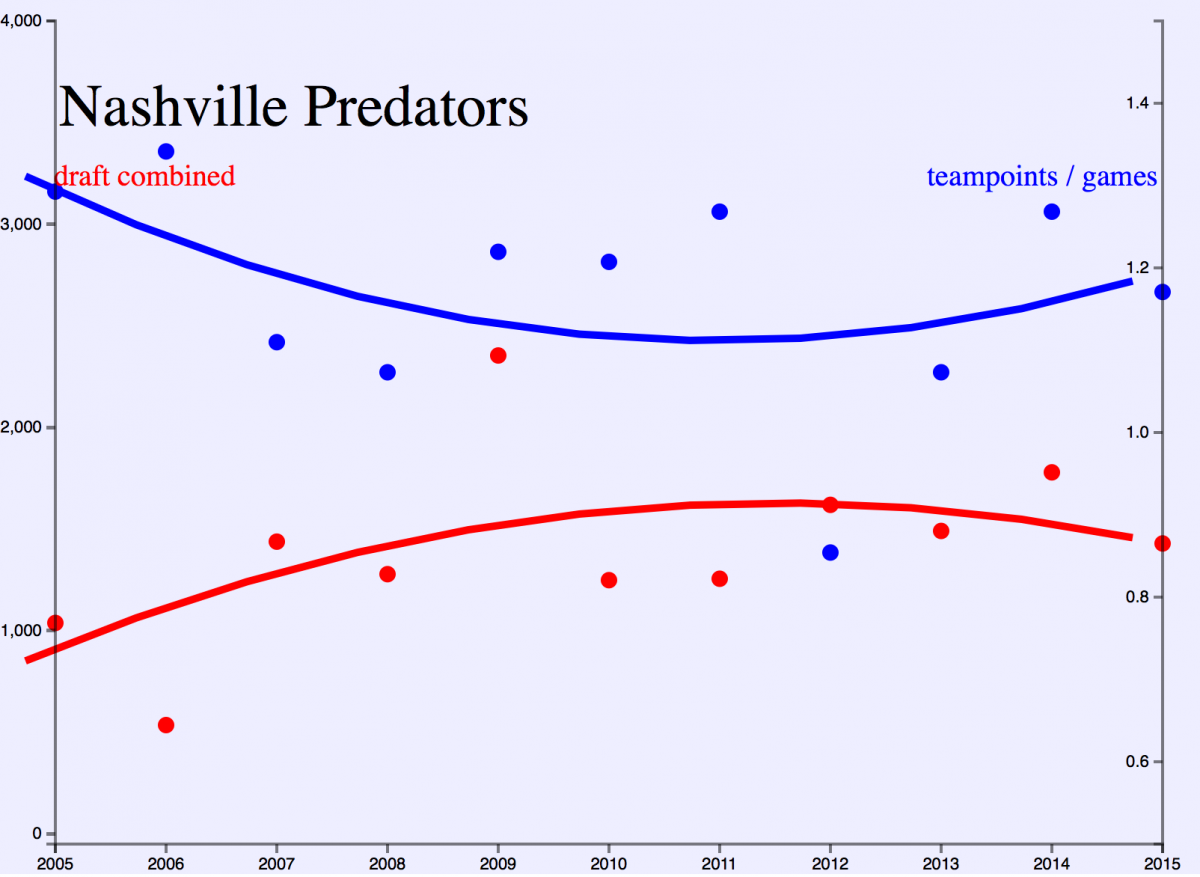
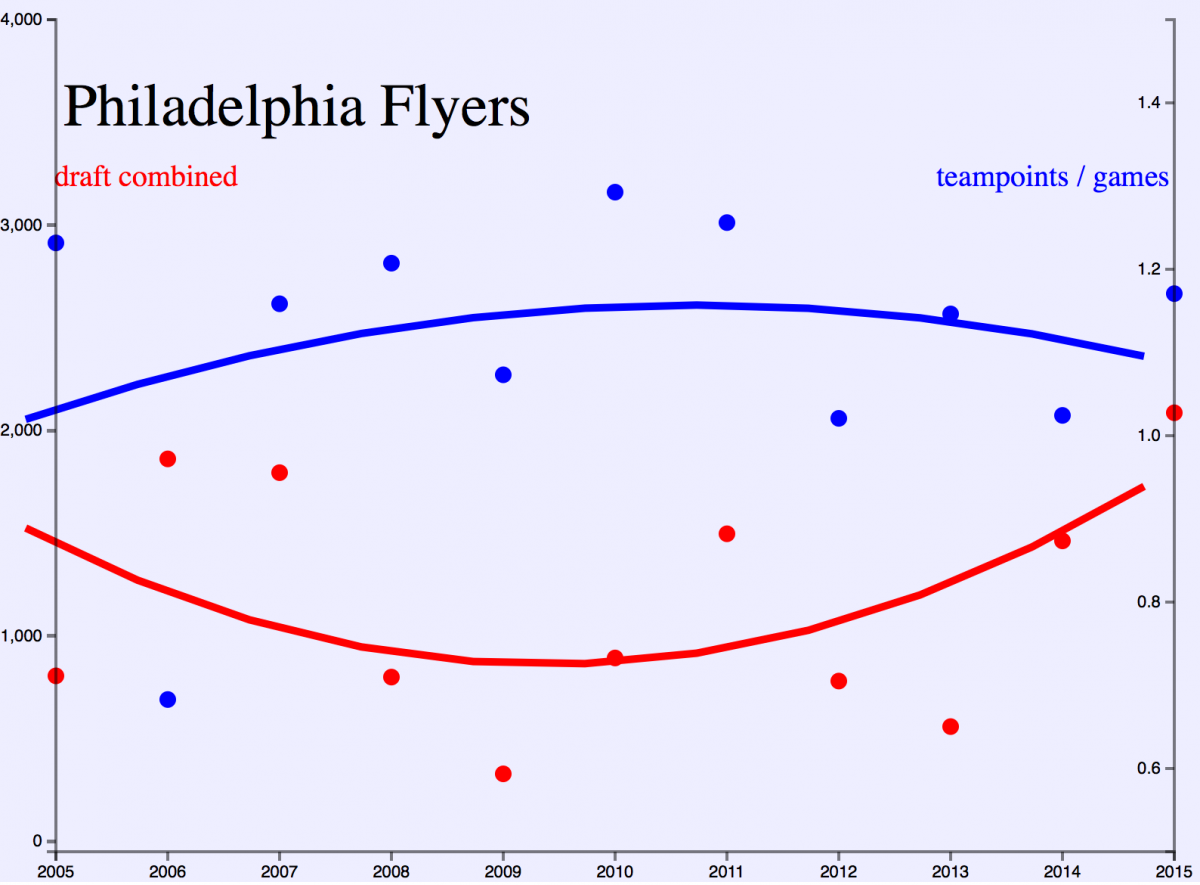
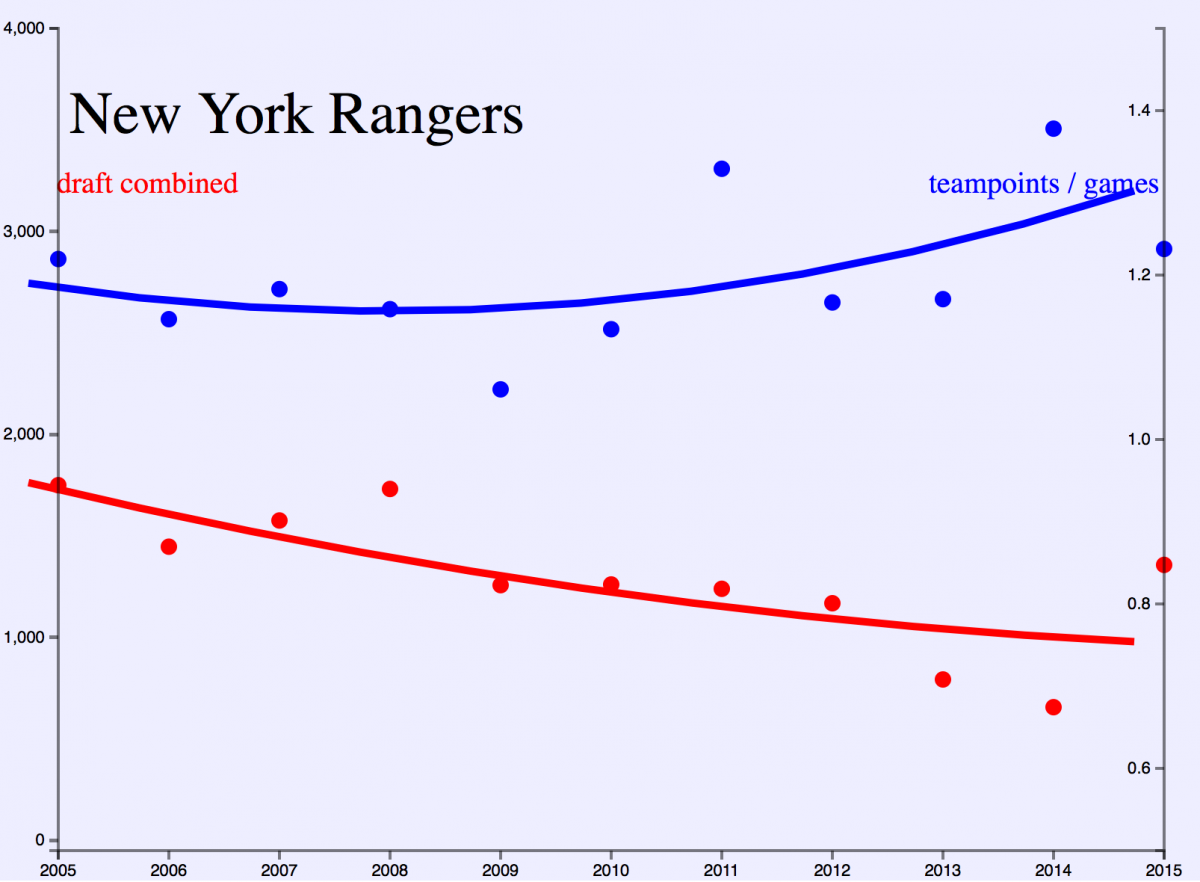
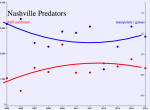
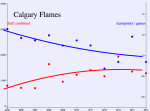
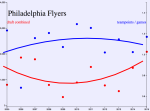
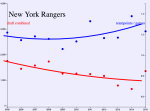
OK, Part 2 We'll again look at the combined chart for 5 teams, then break a couple out. The Nashville Predators draft good enough. They average around 1500, this ought to keep them near cusps for years. The Calgary Flames are terrible at this, or they would be, if not for the New Jersey Devils. Easily the worst drafting team so far would be the New Jersey Devils. They've been averaging about a thousand the last ten years. The most interesting chart so far would be the Philadelphia Flyers. They had good drafts 2006 and 2007, then five years of New Jersey level bad, now two years of really pretty good. The NY Rangers had a few good drafts, 2005-2008, and then recently have been using the strategy of trading picks for players, therefore they have had very meager drafts. It's a strategy, I don't think it will work for them going forward, we will see. Let's examine two of these pipelines, these are the 2015 seasons for recent draft picks of New Jersey and Philadelphia. New Jersey: 2015 Forwards 39 (Among forwards drafted in 2015) PAVEL ZACHA OHL 509 (rakii's raw score, rule of thumb: 1000 is NHL forward, earlier the better) Here you might have an argument that as a power forward his numbers can be lower related to pure scorers, but don't ruin the narrative for me. 47 BLAKE SPEERS OHL 454 Defensemen 49 COLTON WHITE OHL 122 They also drafted a goaltender and an overager (always a good choice), Seney, so he shows up in 2014 2014 Forwards 33 JOHN QUENNEVILLE WHL 645 48 BRETT SENEY NCAA 488 77 CONNOR CHATHAM OHL 277 121 JOEY DUDEK NCAA 60 Defensemen 12 RYAN REHILL WHL 421 44 JOSH JACOBS OHL 214 2013 Forwards 38 MILES WOOD NCAA 709 A World Juniors Under 20 team USA participant 81 RYAN KUJAWINSKI AHL 362 113 BRANDON BADDOCK WHL 173 Defensemen 33 STEVEN SANTINI NCAA 382 Philadelphia 2015 Forwards 8 TRAVIS KONECNY OHL 1132 19 TRAVIS KONECNY OHL 713 24 COOPER MARODY NCAA 602 53 DAVID KASE Czech2 411 I haven't done enough work on leagues like Czech2, so take with grain of salt 63 MIKHAIL VOROBYOV MHL 368 110 SAMUEL DOVE-MCFALLS QMJHL 83 Defenseman 4 IVAN PROVOROV WHL 795 2014: Again, these guys are older, so raw numbers ought to be bigger Forwards: 21 OSKAR LINDBLOM SHL 805 40 NICOLAS AUBÉ-KUBEL QMJHL 566 59 RADEL FAZLEYEV WHL 404 Defensemen 2 TRAVIS SANHEIM WHL 1082 33 MARK FRIEDMAN NCAA 254 2013 Defensemen 24 TERRANCE AMOROSA NCAA 444 30 SAMUEL MORIN AHL 407 50 ROBERT HÄGG AHL 227 64 DAVID DRAKE NCAA 176 So when we break these two teams out, New Jersey has a handful of marginal NHL scorers coming, Philadelphia has three very good prospects in Konecny, Provorov, and Sandheim, and a few of marginal NHL scorers coming, Marody, Lindblom
-
Hardwick is a pun, no?
-
Not Bowers Hardwick? Lockner?
-
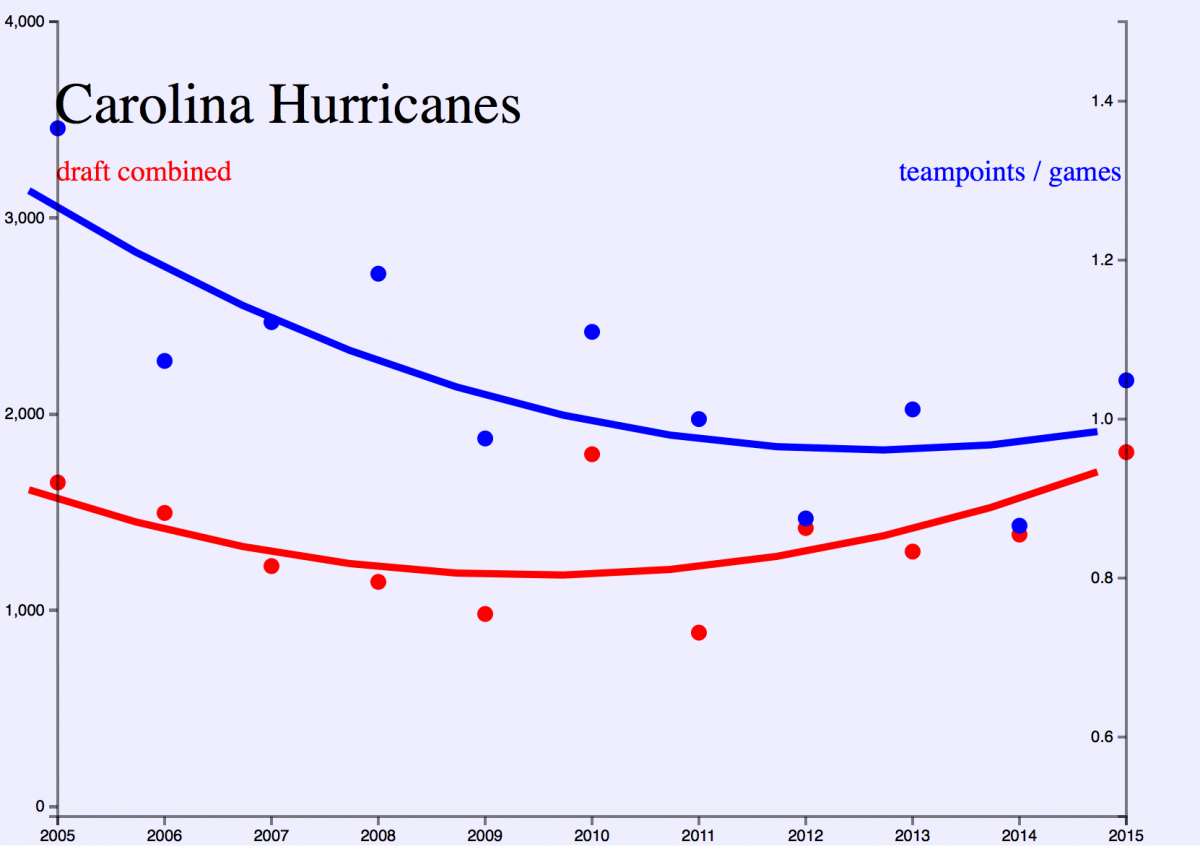
To understand where I am in this WC, I got to look at old charts to see if they make sense, because if the math doesn't work on previous years, it won't work in the future either. So don't think I take it as an insult, I need to find the mistakes. I'm not sure yet what you're asking, but my guess is that my combined Detroit draft is too low. Detroit recent years 2010: 2163 2011: 2573 2012: 757 2013: 1355 2014: 1729 2015: 1074 Carolina : 2010: 1796 2011: 887 2012: 1420 2013: 1300 2014: 1386 2015: 1806 So over the past 6 years, Detroit has gotten 200 points better out of the draft per year than Carolina. These charts are rather broad-strokes, and I'm really just looking at the relationship between how the team drafts, and how the team wins in subsequent years, and seeing if the model is successfully predicting this or not. I think you might be looking for the Detroit version of the pipeline thread from last week. So these are the 2015 rankings for recent drafts. 2015: YEVGENI SVECHNIKOV (raw number 565 , rank in draft among forwards 30th) ADAM MARSH (265, 76) CHASE PEARSON (261, 77) VILI SAARIJÄRVI(110, 51st among defensemen) 2014: remember these guys are older, so raw numbers will be bigger DYLAN LARKIN (1233, 5th among forwards) AXEL HOLMSTRÖM (814,20) DOMINIC TURGEON (420,57) CHRISTOFFER EHN (SuperElit 370,64) 2013: ANTHONY MANTHA (980, 20th among forwards) TYLER BERTUZZI (481,63) JULIUS VÄHÄTALO ( 345,85) ZACH NASTASIUK AHL (340,86) DAVID POPE NCAA (194,109) MARC MCNULTY WHL (597, 18th among defensemen) MITCH WHEATON WHL (286,41) So going back to this morning's chart. I think the 2015 draft and the 2013 draft look about the same as they had at the time of the draft, and 2014 looks stronger now because, since Eichel outscored Larkin by a lot when Larkin was 17, the model had Larkin way too low as a 17 year old.
-
Need to talk more specifically, who we talking?
-
The SHL is difficult because there seems to be a pecking order for ice time based upon age or experience. I talked to MODO a little about this a month ago. So yeah, SHL players are given a higher rating for 1pt/game than a player in the Q would get, or a player in the USHL, since USHL, I believe, ages out at 17 or so, where in SHL you play with adults. The numbers don't average well, unfortunately, so I need to adjust as I decide that the number is too strong or too weak. Therefore they are always shifting a bit, sometimes a lot. As I was talking about upthread, last week Seb Aho had the second best year among 2015 draft picks, but since then, I've adjusted liiga down, and Aho is now sixth, still a wonderful pick so far for the Hurricane. And yeah, Jamie Benn's strong NHL play influences the value of BCHL 17 year olds, including his own, which makes judging the model by redrafting not very effective, because the model becomes biased from Benn's later play instead of being limited to how he would have looked at the time. It doesn't affect an OHL player much at all, since there are hundreds, but it keeps me from averaging a league like BCHL, which would be much too highly valued if I just took the average of players' future performance. SHL is also difficult because the strength of an SHL team also doesn't tell you anything about how good the player is. For instance, looking at a Q forward like MacKinnon, that type of player is normally on a really good team, therefore I can scale the rating by how good the team is, and MacKinnon's relationship to the team (what you(Liger) call percentage of team goals scored). Finding a relationship between a good team and a good player doesn't work for defensemen, who have a much smaller impact on the quality of the team. (Which is why I would always take Reinhart over Ekblad). The SHL 17 year old is almost always on a bad team, so I can't use that stat to value a 17 year old William Nylander. Olofsson would score more on a good team, and score more playing with Nylander, and score more in the Q than SHL, and almost none at all on the 2014 Buffalo Sabres. I have tons more data this year, so I'm better with the leagues that don't have many players ending up in the NHL. Also, from the scoring thread in SabreSpace, I did a chart about how scoring rates change, which I don't use to value players. I think this is important for Austin Matthews, who's Swiss stats are fairly useless to me, and who's 2014 USDP team scored a whole lot more than Eichel's 2013 team.
-
I ought to break out a year to give you an idea of where numbers are coming from, so here is the 2015 Sabres' draft: JACK EICHEL: 1245 BRENDAN GUHLE: 285 WILLIAM BORGEN: 152 DEVANTE STEPHENS:73 GIORGIO ESTEPHAN: 268 IVAN CHUKAROV:26 So the Sabres 2015 combined is roughly 2000. The chart ends up being forwards biased, since they score more. And for comparison, I'll show a bad year: ZACK KASSIAN 383 BRAYDEN MCNABB 296 MARCUS FOLIGNO 165 MARK ADAMS 61 MAXIME LEGAULT 69 Roughly 1000
-
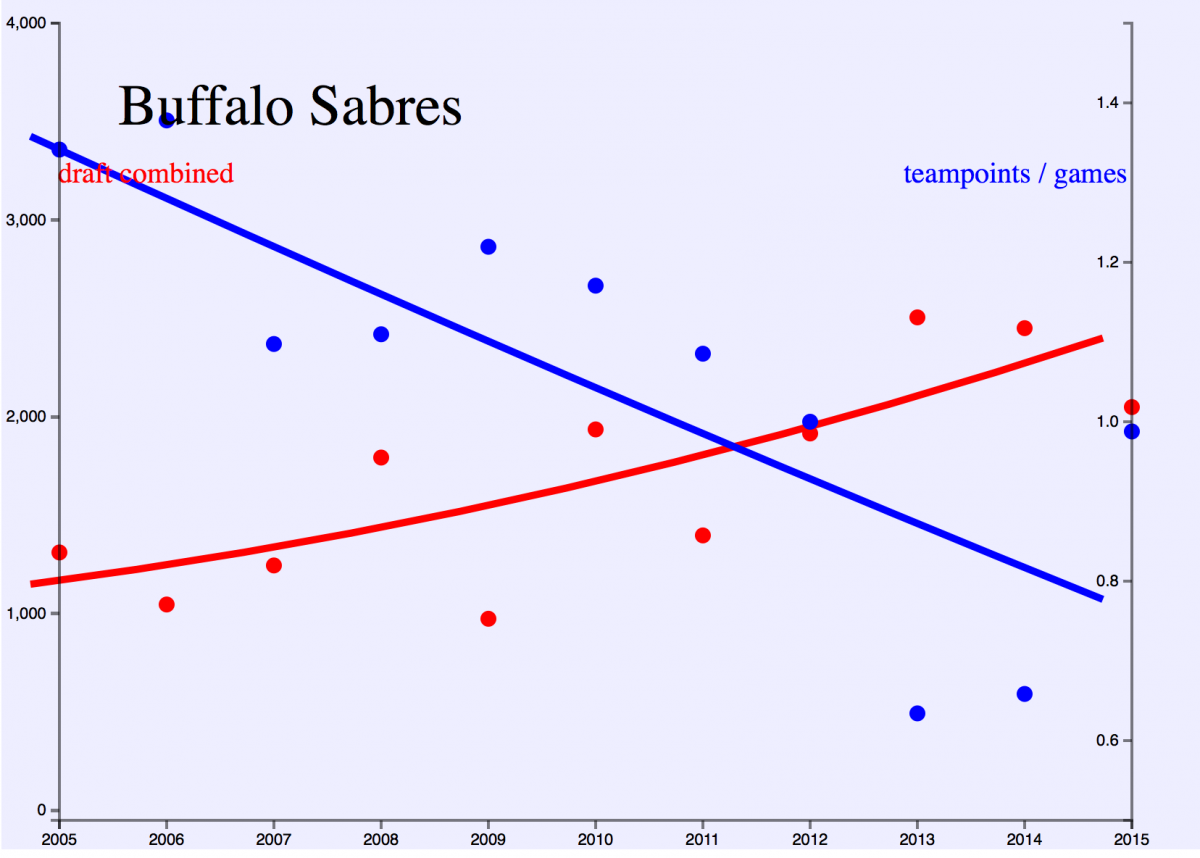
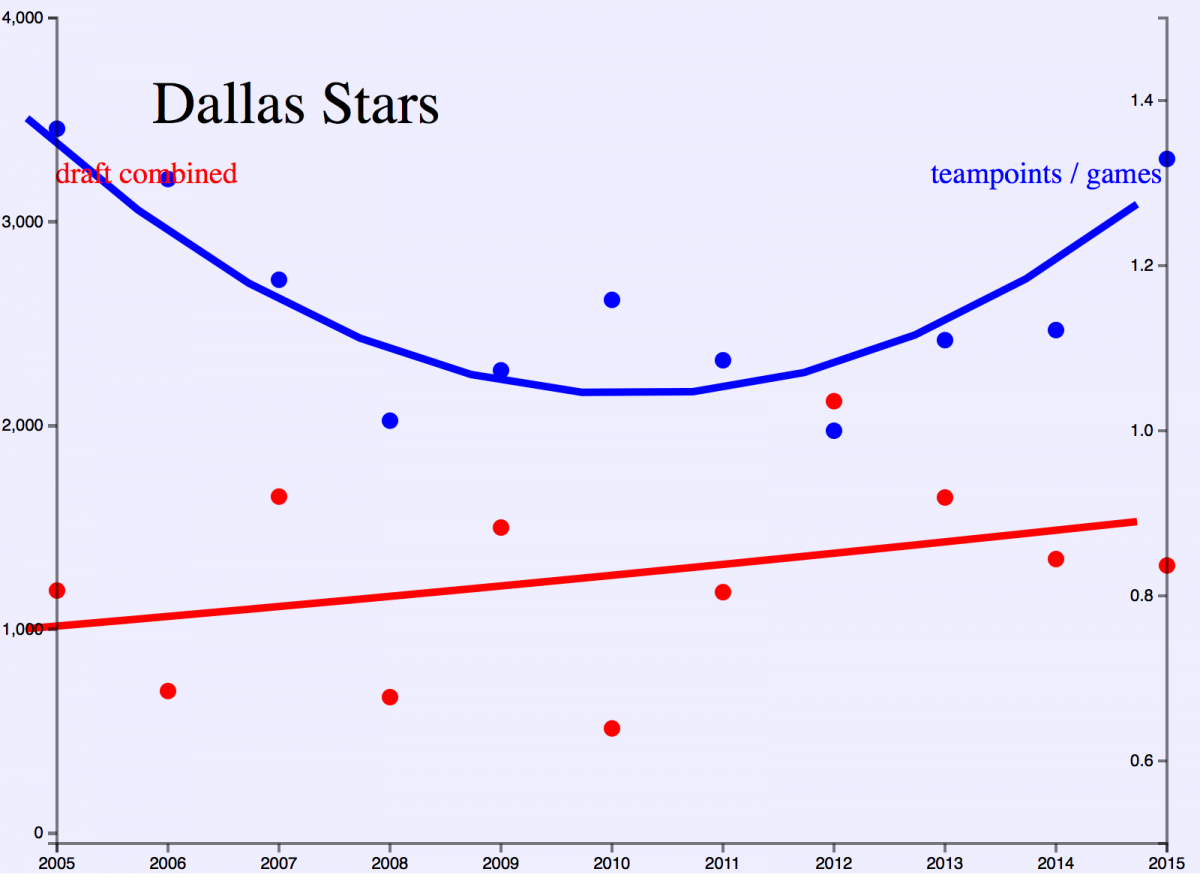
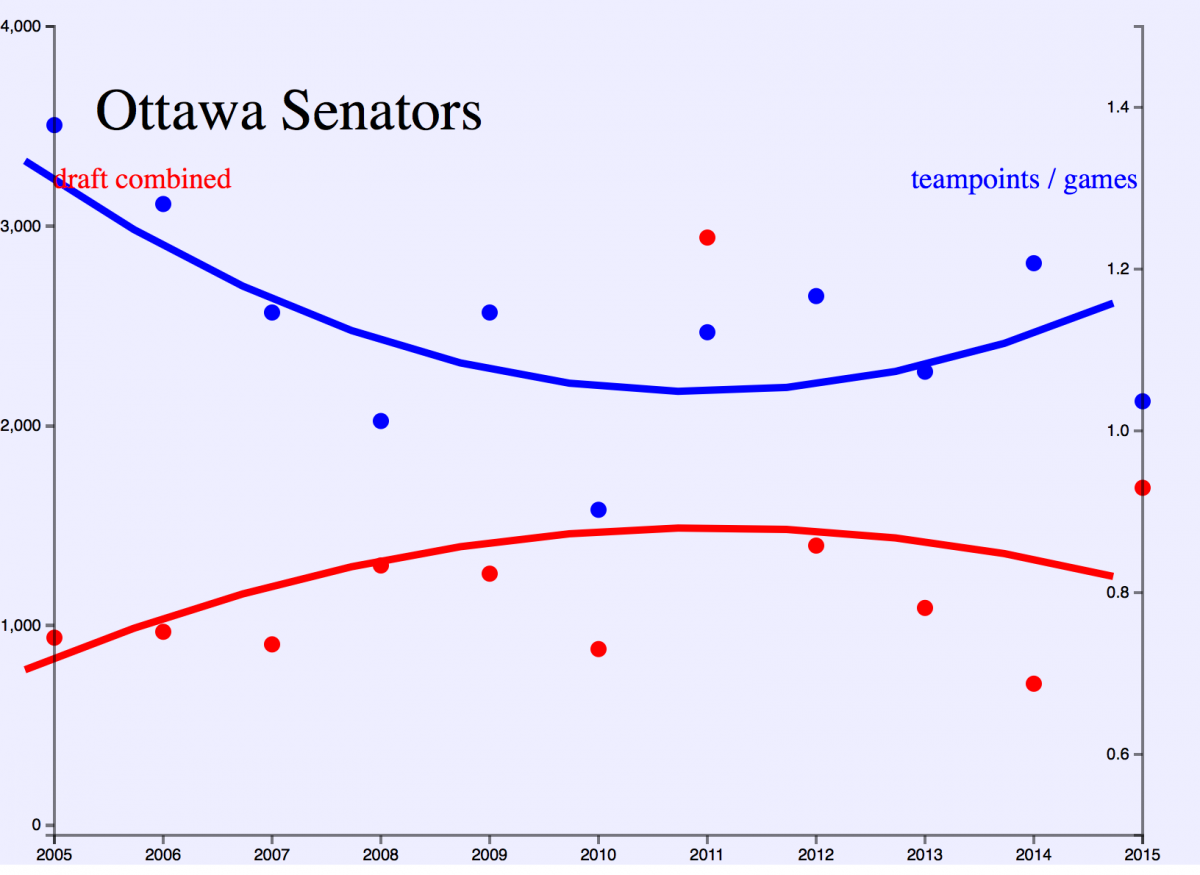
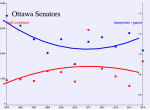
The combined draft rating chart: part 1 I believe that if you can take the combined value of a team's draft history using my draft model, you can get a good idea of how the team will subsequently perform. Am I sure about this? Well, I've only looked at a fistfull of teams, so we'll see as this rolls out. So the draft rankings come from how they looked at the time. For example Ottawa, with three first round picks in 2011, had a very good year from the model's point of view, but it hasn't really panned out. We'll look at Buffalo first. 2005-2011 the chart shows roughly a combined 1200 average, which isn't good enough. As the Sabres moved far enough forward in the draft, their combined total have been over 2000 the last three seasons, which seems to be the number a team needs to get to, so from this chart, and as you would expect, Buffalo looks good for a few years out. Detroit: The model really liked Detroit's 2010 and 2011 draft, each over 2000, but subsequent drafts have not been quite good enough. The model thought the 2015 draft was particularly bad, by Detroit's standard, an indication that the front office talent may be in Dallas. Carolina hasn't broken 2000 in the 11 years of the chart, although 2015 was almost good. Dallas had a fine 2012 draft, but they're not a team built around high draft picks. The draft regression line is improving. Ottawa: The model liked their 2015 draft, so not all hope is lost, but if you look at the draft regression line, Ottawa doesn't draft well enough. So part 1 ends for me with 'eh, sort of interesting'


-
I would skip actually learning Ruby, and adapt my code to fit your needs. Ruby isn't anything to be worried about, you can look at it and understand it, and you would just be using it as a scripting language, not like you're trying to learn Rails or anything like that.
-
I spent a little time this afternoon looking at options. Two options are pre-made tools, one written in R, another written in Python. I will do a general overview of how I do it. To start, find the Sabres schedule on NHL.com http://sabres.nhl.com/club/schedule.htm using this page we find all 82 play-by-play htmlreports. To do this, I use, Selector Gadget. NHL.com hides the play-by-play htmlreports, but you can find each one because they are similar to the recap URL on the schedule page. So using Ruby, I loop through the schedule page scraping the recap link, then using that information to open the htmlreport. I save the play-by-play to my computer so I'm not needing to access nhl.com each time I want to look at the htmlreport. Once on my computer, I go through the htmlreport gathering the information I'm interested in, and that again is done in Ruby. This was the start of a game against Ottawa. Notice that the Sabres start the game with 63-90-26-6-46 and 40. My software goes down the play-by-play converting this format into the format I want to use. 1 1 0:00 20:00 PSTR Period Start- Local time: 7:10 EDT 7 C 68 C 61 R 3 D 65 D 41 G 63 C 90 C 26 L 6 D 46 D 40 G 2 1 EV 0:00 20:00 FAC OTT won Neu. Zone - OTT #7 TURRIS vs BUF #90 O'REILLY 7 C 68 C 61 R 3 D 65 D 41 G 63 C 90 C 26 L 6 D 46 D 40 G 3 1 EV 0:30 19:30 GOAL OTT #7 TURRIS(1), Wrist, Off. Zone, 35 ft. Assists: #68 HOFFMAN(1); #61 STONE(1) 7 C 68 C 61 R 3 D 65 D 41 G 63 C 90 C 26 L 6 D 46 D 40 G 4 1 EV 0:30 19:30 FAC OTT won Neu. Zone - OTT #93 ZIBANEJAD vs BUF #15 EICHEL 27 C 93 C 6 R 2 D 74 D 41 G 15 C 23 C 9 L 3 D 4 D 40 G 5 1 And that it. I use JSON files to store the data, then D3, a javascript framework, to make the chart.
-
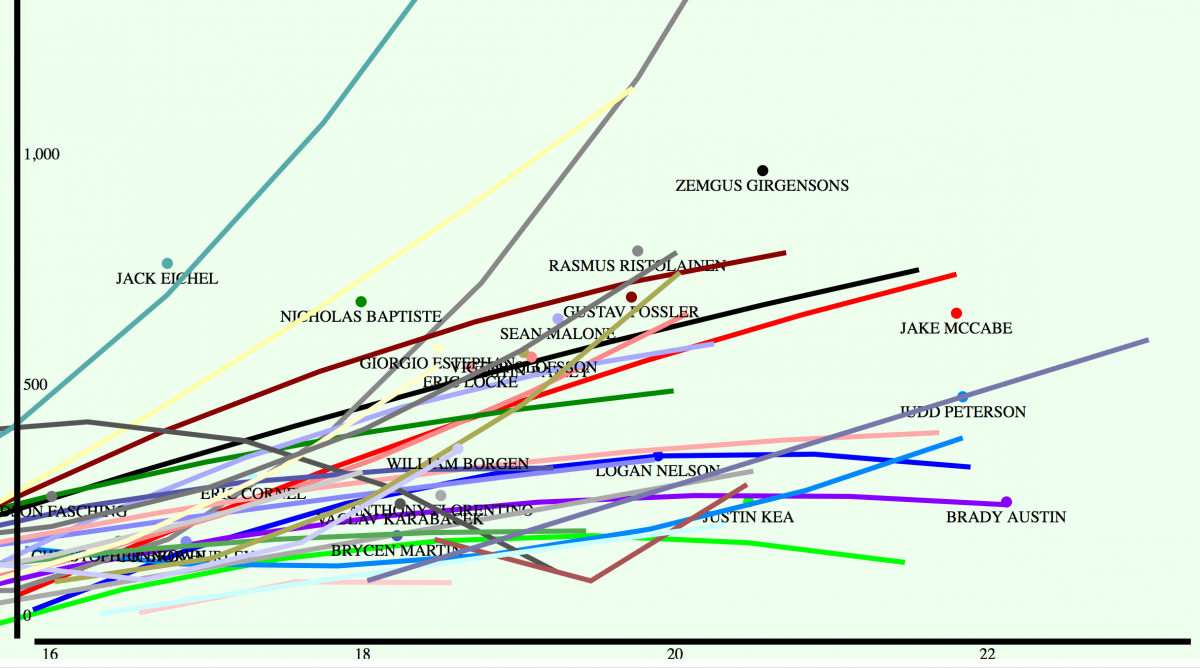
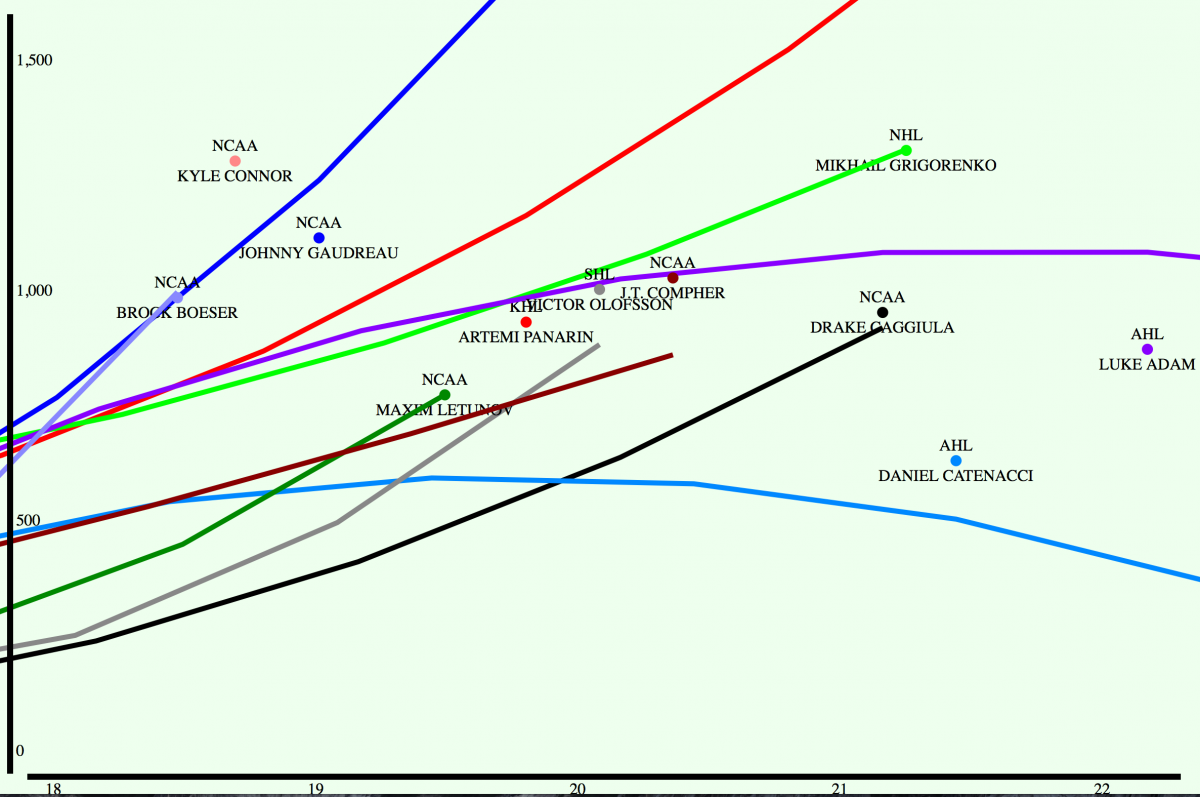
x is age y is my valuation. As I talked about in the Caggiula post, a forward who scores roughly 1000 is ready for the NHL, defensemen are trickier. As to what 1000 means here, no forwards are close to that, Fasching could be a Sabre this year because he plays a position that doesn't require scoring, which is why you get a separate chart comparing Fasching to, as I perceive, similar players. The smaller players, Oloffson, Possler, in my view, aren't close enough to 1000 yet.
-
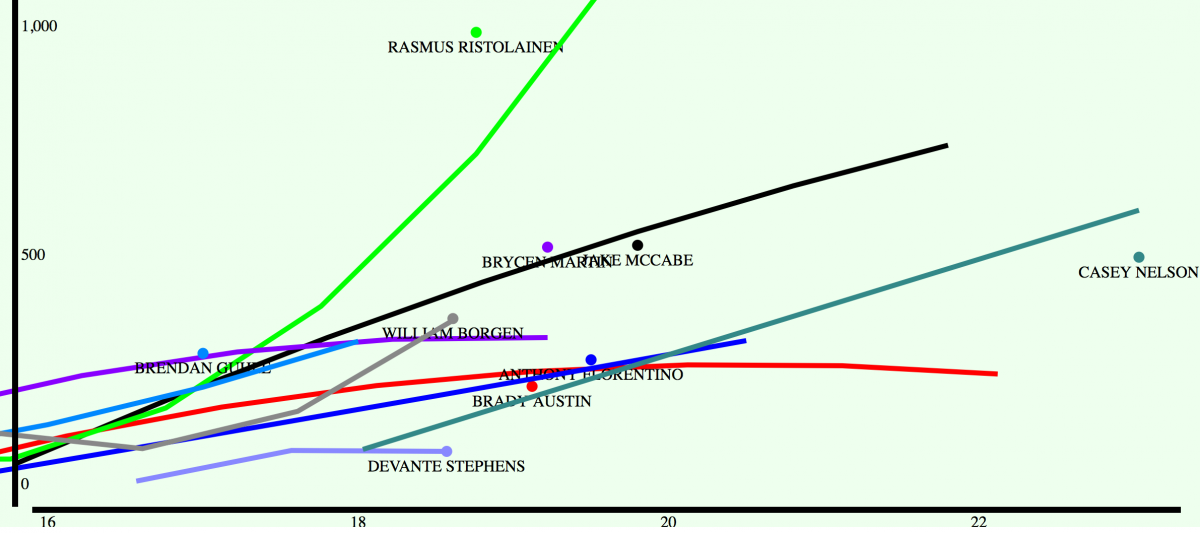
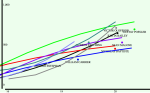
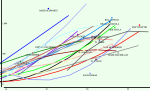
The Sabres Pipeline The first chart contains everyone drafted in the last three years. The lines that go straight up and down represent Eichel and Risto, the yellow line Reinhart. You know those guys, so this isn't telling you anything. It's messy and unreadable, so I'll trim off half or so. The the next chart are only the good forwards, but without Eichel and Reinhart. I made a list of how these guys compare to their draft class in their latest year. Eichel (3rd best forward from 2015 draft, if you are wondering, Sebastian Aho had a very good year, but it's likely my liiga value is too high, so this will likely move to second next time I look at my liiga value.) Reinhart (6th from 2014) Hudson Fasching (32nd from 2013) Giorgio Estephan (27th from 2015) Victor Oloffson (36th from 2013) He actually was drafted in 2014 as an overager, but I've decided to classify overagers with their draft class. Gustav Possler (39th from 2013) Justin Bailey (44th from 2013) Sean Malone (56th from 2013) William Carrier (58th from 2013) Nick Baptiste (65th from 2013) The defensemen chart. Risto (2nd best defenseman from 2013 draft) William Borgan (16th from 2015) Jake McCabe (20th from from 2012) Brendan Guhle (24th from 2015) Brycen Martin (6th/52nd from 2015) Casey Nelson (26th from 2012) Anthony Florentino (40th from 2013) The fourth chart is a small collection of power forwards, snipped at age 20 for each player. This shows Fasching comparable to other power forwards at his age. Right now his regression line duplicates Wayne Simmonds, but Marcus Foligno looked really good at age 20. So removing the four who are fulltime NHL players, for me, the pipeline looks like: Fasching Borgen - Making the World Juniors is an important metric. Guhle Estephan Martin - Martin has had very good partial seasons mixed with poor partial seasons. I'm guessing last season can be explained by moving to a team with a better prospect, therefore he didn't get power play time. It's interesting to me because most players are consistent, while Martin has been both very good, and not so good, scoring. Oloffson Possler - Possler had a big season a couple years ago, although it wasn't a lot of games. Bailey Nelson - While Nelson's regression line lies below McCabe's, it doesn't necessarily mean he would score less. The charts are contextualized for weight, or else all the best defensemen would be really small. It also benefits Nelson that I don't have his weight at age 17, as I do most everyone else.

-
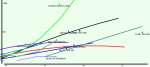
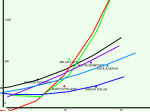
Sorry Liger, I'm not getting to 2016 soon. I want to do some pipeline writing and some old draft writing, getting to the new draft sort of ends valuation work, so I want to postpone it some. I'm taking a mulligan on the first Caggiula chart. It needs not to be Sabres' focused, but NCAA focused, and also the math has changed some, to Caggiula's benefit. This time, as comparables, I used about 18 NCAA players from relatively recent drafts. Using NCAA players allows me to eliminate a variable and by using, more or less, all smalls, everyone compares by size. The farthest away from average size in this group would be Arnold, who is heavy and Gaudreau, who is light. I have a rule of thumb that, when prospects get to 1000 on my valuing system, they are about ready for the NHL, but the age at which they reach 1000 is critical in determining how much they are going to score in the NHL. Caggiula (the black line) had a good year in 2015 at age 21, but Schwartz (the royal blue regression line) had a better year at age 18, so I think of it as Jaden being 3 years ahead in development. The next regression line belongs to Gaudreau (steel blue), whose 19th year was almost as good as Caggiula's 21st, and his 20th year better. Conacher (the light blue) has an interesting curve because he peaks at age 19. At the other end, Matt Frattin had a comparable year to 2015 Caggiula, but did so at age 22. I clipped later seasons off the chart, mostly AHL and NHL, leaving 18 relatively random NCAA players in their best collegiate year. Jaden Schwartz 1200 age 18 Johnny Gaudreau 1300 age 20 Cory Conacher 1200 age 19 JT Compher 1100 age 20 Matt Nieto 820 age 18 TJ Oshie 840 age 19 Jason Zucker 800 age 19 Bill Arnold 1090 age 21 (Played with Gaudreau in college) Drake Caggiula 1025 age 21 Erik Haula 930 age 21 Travis Boyd 900 age 21 (A Capitals prospect) Kenny Agostino 790 age 20 (A Calgary prospect) Brian Flynn 900 age 21 Zach Hyman 1100 age 22 (In Toronto) Matt Frattin 970 age 22 TJ Tynan 730 age 18 Max McCormick 640 age 21 Mark McMillian 600 age 22 So my view pretty much remains the same, offer contract? sure, why not? Put him on the first line? No, don't think so.
-

The Great Sabrespace Draft Meetup - Big Ditch Brewery ~5-5:30
rakish replied to TrueBlueGED's topic in The Aud Club
I'm expected, but it's at the end of a 9 hour drive, and will have girlfriend with me, so I don't expect to stay long. -
It'll be a few days
-
this year? I'm still looking at old stuff, got a list?
-
For me, meaningless is the wrong word, but still, I have two problems with plus/minus. First, the stat is very very elastic. As an example as to what I mean, look at baseball stats after the first week. Some guy will be hitting 456, and your nine-year-old kid says "Dad, he's TBEV," or whatever acronym the kids use for the best player ever. And you will say, wait a few months, this happens every year, the stat is very elastic. Plus minus is the same way, but where batting average seems to find it's level by mid-season, plus/minus can be way high or way low for an entire season. It's not meaningless, because if you look at the players with the best plus minus over their careers, it's all the TBEV's, but even a full year is too short a time span to mean much. Secondly, it's not adjusted to the skill of your opponent or your teammates. O'Reilly, Eichel, and Reinhart are good, but they got crushed this year in plus/minus because the Sabres don't have enough good players. Without looking into it, I imagine McCabe was playing with the 3rd line, against other teams 3rd line, which seemed to hold it's own this season, but again, I'm not sure, since the stat is so elastic. Additionally, as I've talked about before, players like O'Reilly and Risto got way too many minutes this season, and each stopped scoring the second half of the year. This benefited players like McCabe, who worked under more reasonable minutes per game. I think Blue confuses things because he emphasizes GF/60 and GA/60, which essentially is plus/minus. I tend to agree with Blue and most everyone else that a couple defensemen are needed.
-
Ah, i misunderstood your previous post, thank you
-
I certainly agree he shouldn't, and you might be right that he won't, but it seems a lot of teams are standing in line, and looking at the world from his agents perspective, what differentiates the multiple offers?
-
I wouldn't be excited about putting Caggiula into a top-six for a team trying to make the playoffs. Unfortunately, you might not have the option of sending him to Rochester. I think he'll get a one-way contract from someone with some assurance he plays in the NHL next year. I'll work through each draft since 2005 once I get the math a bit better, but at this point Caggiula's 2015 year was 50th best among the his draft year, and about 50 players from each draft have a reasonable NHL career, therefore I expect him to get some games in the NHL. I think my takeaway from this is that he's not Panarin or Gaudreau, but, like Bailey, he's getting better. If I was to slot him in the pipeline for forwards, I would say behind Bailey, near Olofsson and Cornel, even though Caggiula is the oldest of the four. I guess signing him is fine, but I would expect him to be in Rochester next year if he does sign.
-
OK, a new year is here. I'm not done with the work, but the question of Caggiula has time pressure, so I thought I put out an early chart even though it's not strictly draft related. So in case you're new here, I contextualize scoring (it does matter that Caggiula plays with Brock Boeser, if that is not true, let me know and I'll rethink this) and come up with a valuation for each season (anything over 10 games played, so sometimes a player has 2 or 3 seasons in a year). I wanted to use players you have a better sense of, therefore Luke Adam, Catenacci, Grigo. I also used comparables that I think you are trying to compare Caggiula to Panarin, Gaudreau. Thirdly, I used one player I think is a very good comparison, Sabres' prospect Victor Olofsson, and fourthly, I tossed in some of the current NCAA stars, Connor, Boeser, Letunof, JT Compher,. If you want to see different comparables, I can use anyone drafted after Sidney Crosby. The left axis is my raw number, the bottom axis the age. The colored lines are regression lines for each of the players.

-
You are in the wrong thread, that said, http://espn.go.com/nhl/story/_/id/14787151/picks-team-2016-nhl-draft The ESPN chart isn't very accurate, for instance it doesn't mention that the Anaheim 3rd round pick can become a second. Wikipedias page on the 2016 draft has all the horrible detail.